Tourism Research
Tourism in Vermont is a $3 billion industry that supports over 30,000 jobs (over 10% of Vermont's workforce).
The Vermont Department of Tourism & Marketing collects and compiles data on visitor spending, tax revenue generated, employment in the sector, and visitation to define the economic impact of tourism in Vermont. The information below reflects key data that we monitor on an annual basis as a way of assessing trends and the health of the industry as a whole.
Data is collected from various state and federal agencies, as well as partner organizations and research firms in the travel and tourism sector as noted.
- Economic Impact and Visitation Trends
- Tourism Benchmark Reports
- Sector-Specific Economic Impact Reports and Data
- Relocation Programs
Economic Impact and Visitation Trends
Travel Spending by Visitors in Vermont
| 2019 $2.9 billion |
2020 $1.6 billion |
2021 $2.3 billion |
2022 $2.8 billion |
2023 $3.0 billion |
|---|
Source: U.S. Travel Association as compiled by Tourism Economics
Tourism Related Taxes, Employment and Trends
Tax Revenues
| Tax Revenue by Year | 2019 | 2020 | 2021 | 2022 | 2023 |
|---|---|---|---|---|---|
| Total Estimated Tax Revenue Generated by Tourism | $367,700,000 | $328,700,000 | $327,700,000 | $387,300,000 | $417,300,0001 |
| Tourism-related Tax Revenue: Rooms, Meals, Alcohol, Retail, Gas | $163,800,000 | $128,200,000 | $177,700,000 | $207,900,000 | $178,400,0002 |
| Tourism-related Tax Revenue: Rooms/Lodging | $54,700,000 | $35,200,000 | $64,700,000 | $80,400,000 | $67,900,0003 |
Source: Internal analysis based on tax data from the Vermont Department of Taxes and employment data from the Vermont Department of Labor. Includes rooms, meals, alcohol, and gas taxes attributed to visitors, as well as income taxes collected from employees in the leisure and hospitality sector and property taxes paid by second-home owners. Methodology available in 2017 benchmark report.
1: Rooms, meals, alcohol taxes reporting through October 2023 only / retail tax, property tax, and gas tax calculations based on full year reporting / income tax calculations based on wage reporting through September 2023 only
2: Meals, rooms, alcohol taxes reporting through October 2023 only / retail tax, property tax, and gas tax calculations based on full year reporting
3: Preliminary reporting through October 2023
Employment
| Employment by Year | 2019 | 2020 | 2021 | 2022 | 2023 |
|---|---|---|---|---|---|
| Total Number of Jobs in Leisure and Hospitality (and Percentage of Vermont’s Workforce) | 37,893 (12.2%) | 25,993 (9.2%) | 29,541 (10.1%) | 33,140 (11.1% | 35,643 (11.5%)1 |
| Jobs in Arts, Entertainment, and Recreation (subset of total Leisure and Hospitality jobs) | 4,144 | 3,186 | 3,704 | 4,141 | 5,356 |
| Jobs in Accommodations and Food Services (subset of total Leisure and Hospitality jobs) | 33,749 | 22,806 | 25,837 | 28,998 | 30,287 |
Source: Vermont Department of Labor
1: Reporting through September 2023
Wages Paid in Leisure and Hospitality Sector
| 2019 $888 million |
2020 $678 million |
2021 $826 million |
2022 $996 million |
2023 $824 million 1 |
|---|
Source: Vermont Department of Labor
1: Reporting through September 2023
Visitation Trends
| Visitation Trends by Year | 2019 | 2020 | 2021 | 2022 | 2023 |
|---|---|---|---|---|---|
| Camping and day-use visitation by Out-of-state Visitors at Vermont State Parks (Source: VT Department of Forests, Parks and Recreation) | 373,648 | 260,382 | 389,693 | 385,578 | 323,845 |
| Skier visits (for seasons ending in the year indicated) (Source: Vermont Ski Areas Association) | 4,178,533 | 3,664,326 | 3,532,186 | 3,762,047 | 4,134,832 |
| Annual Visitor Traffic at the Vermont Information Centers (Source: Vermont Department of Buildings and General Services) | 3,269,856 | 856,067 | 1,718,601 | 2,294,465 | 2,449,824 |
| Burlington International Airport Enplanements (Source: Burlington International Airport) | 705,165 | 209,320 | 388,834 | 615,877 | 660,097 |
| Crossings at the U.S.-Canadian Border into Vermont (Source: US Department of Transportation) | 2,489,941 | 401,650 | 220,294 | 1,407,329 | 2,102,027 |
Hotel Trends
| Hotel Trends by Year | 2019 | 2020 | 2021 | 2022 | 2023 |
|---|---|---|---|---|---|
| Average Monthly Occupancy Rate | 61.8% | 41.5% | 61.9% | 69.4% | 66.3% |
| Average Daily Rate (ADR), Annually | $146.40 | $119.40 | $154.30 | $180.90 | $188.80 |
Source: Smith Travel Research
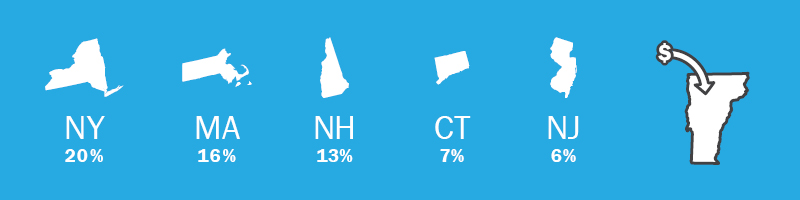
A large percentage of visitors to Vermont come from neighboring states including New York, Massachusetts, New Hampshire, Connecticut, and New Jersey, however even states as far away as California and Texas contribute tens of millions of dollars to our economy each year.
Top 15 States Bringing Visitor Traffic (including approximate market value/spending)
| 2020 NY ($351M) MA ($238M) NH ($204M) NJ ($118M) CT ($112M) FL ($57M) PA ($54M) CA ($27M) VA ($22M) TX ($21M) ME ($20M) MD ($20M) RI ($19M) NC ($15M) CO ($12M) |
2021 NY ($413M) MA ($323M) NH ($262M) CT ($143M) NJ ($137M) FL ($84M) PA ($83M) CA ($65M) VA ($44M) TX ($43M) MD ($38M) ME ($35M) RI ($29M) NC ($28M) CO ($27M) |
2021 NY ($444M) MA ($369M) NH ($301M) CT ($165M) NJ ($136M) FL ($101M) PA ($82M) CA ($66M) VA ($44M) ME ($42M) MD ($39M) TX ($38M) RI ($34M) NC ($33M) CO ($33M) |
2023 NY ($443M) MA($367M) NH ($317M) CT ($162M) NJ ($127M) FL ($107M) PA ($80M) CA ($65M) VA ($44M) ME ($43M) MD ($39M) TX ($38M) RI ($33M) NC ($33M) CO ($30M) |
|---|
Source: Estimated spending in Vermont by visitors from noted states, extrapolated using credit card spending data
Additional research on visitor profiles was last conducted in 2014 in a joint project between VDTM and the Vermont Tourism Research at the University of Vermont. The summary report provides survey data from visitors about their tourism and recreation experiences in Vermont at welcome centers, state parks, and attractions.
Tourism Benchmark Reports
Periodically the department develops a larger encompassing study that captures a number of significant insights and puts tourism numbers and trends into context.
Sector-Specific Economic Impact Reports and Data
Outdoor Recreation
Spending time recreating outdoors is often what drives visitors to Vermont for the first time and the economic impact of outdoor recreation continues to grow.
- The U.S. Bureau of Economic Analysis compiles annual statistics on the contribution of outdoor recreation to the economy on a state level.
- The 2022 report shows that outdoor recreation accounted for 4.6% of Vermont's GDP – second highest in the nation behind only Hawaii (5.6%)
- In 2021, Vermont’s GDP from outdoor recreation rose to 4.1%, the third highest in the nation behind Hawaii and Montana.
- The 2020 report shows outdoor recreation accounts for 3.7% of Vermont’s GDP.
- In 2017, Governor Phil Scott established the Vermont Outdoor Recreation Economic Collaborative (VOREC) with the charge of promoting prudent stewardship of State recreation assets and marketing the outdoor recreation values and attributes of Vermont to effectively foster economic growth. VOREC’s work to strengthen Vermont’s outdoor recreation economy includes the popular VOREC Community Grants Program.
- The Vermont Tourism Center at the University of Vermont collects research on Outdoor Recreation and Trail Use as well as the Northern Forest.
- In 2012, the Agency of Commerce and Community Development completed a study on the Economic Impacts of Walking and Biking.
Arts and Culture
Arts, culture, and other creative enterprises are key economic drivers and the vital anchors for many of Vermont’s communities. The Vermont Arts Council and Vermont Creative Network have commissioned, complied and collaborated on a variety of research projects documenting the economic impact of the creative sector in Vermont.
- According to the 2022 U.S. Bureau of Economic Analysis, arts and cultural production in Vermont contributes $1.16 billion to the economy, accounting for 2.85% of the state's total economic output and supporting 10,574 jobs
- In 2022-23, the Vermont Arts and Economic Prosperity 6 (AEP6) report found that the sector generated $158.6 million in economic activity during 2022—$103.2 million in spending by arts and culture organizations and an additional $55.4 million in event-related expenditures by their audiences. That economic activity supported 2,712 jobs, provided $112.8 million in personal income to residents, and generated $34.8 million in tax revenue. Visit the Vermont Arts Council site to learn more, including about the 2022 National AEP6 Study, which showed the importance of the nonprofit arts and culture sector nationwide.
- In 2019 the Assessing Vermont’s Creative Economy study documented over 40,000 jobs in the creative economy sector in Vermont.
- In 2017, the national Arts & Economic Prosperity 5 survey documented that the nonprofit arts and culture industry in Vermont generated $123 million in economic activity. Field research for the latest AEP6 study was conducted in 2022 and 2023, with findings anticipated to be released in September 2023.
Agriculture, Agritourism and Vermont-Made Products
Eating local in Vermont has been a way of life for many, long before the phrase “farm-to-table” was coined, and Vermont is recognized as a national leader in both agritourism experiences and for producing high-quality craft beverages and specialty food products.
- In June 2023, Penn State completed and released state-by-state factsheets intended to provide insights into Agritourism and direct sales.
- The VT factsheet shows that Vermont has a total of 6,808 farms, 1,953 of which offer direct sales or agritourism.
- Recognizing the importance of agriculture and food to Vermont’s economy, environment, and culture, the Vermont Sustainable Jobs Fund (VSJF) was reauthorized in 2019 to create a second 10-year strategic food system plan.
- The Vermont Agriculture & Food System Strategic Plan 2021-2030 includes specific issue briefs on:
- The Vermont Tourism Center at the University of Vermont provides tools, resources, and research findings for farmers and agricultural service providers looking to learn more about the economic opportunities that agritourism provides.
- The Agency of Agriculture, Food and Markets is also a great resource for regulations and policy research on agritourism and market development research on specific products, including a Maple Data dashboard.
Relocation Programs
In 2018, the Vermont Department of Tourism & Marketing launched the Stay to Stay Program to support the state's efforts in attracting, inspiring and assisting people interested in moving to the state. The program has since evolved and been fully integrated into the larger the Think Vermont initiative and regional relocation network.
- 2021 Stay to Stay Program Update
- 2019 Stay to Stay Program Report
- 2018 Stay to Stay Pilot Program Report
Additional reports on relocation incentive programs administered by the Department of Economic Development include annual reports on funds awarded and an economic analysis conducted by the Department of Financial Regulation.